Showing posts with label Software Management. Show all posts

28 April 2015

Analyzing 2-mode Network using Pajek Part 3


Before in Part 1 and Part 2 of this series of Analyzing 2-mode network using Pajek software I already told you about how to simplified a network and find centrality of a network. Now in this part, I wanna tell you about how to do hierarchical clustering in a network.

Using simple human language, cluster is something that grouping several people that have same characteristics. So, it can be easier to find out something in a large social network.


First, open your simplified network


Second, follow this instruction :
Cluster - Create Complete Cluster
Operations - Network + Cluster - Dissimilarity* - Network based - d5 Correct Euclidian 
Fill the pop-up window with 0
Save the file which is EPS file that contains dendogram of the clustering
Open the dendogram file using Ms. Word.

This dendogram explain how people clustered based on their future dreams.


But you can also see the hierarchi through Pajek with clicking File - Hierarchy - Viet/Edit . Then, a small window of hierarchy will pop-out and you can drop down the root and see there are two clusters there.


To close the tree, you can click Edit - Change Type in the viewing hierarchy window.


To know the result, you have to do the partition first with clicking Hierarchy - Make Partition. Then, you can draw the network with Draw - Network + First Partition


The result is like the picture below. The network clustered into two clusters. Each cluster presents people who has the same future dreams.


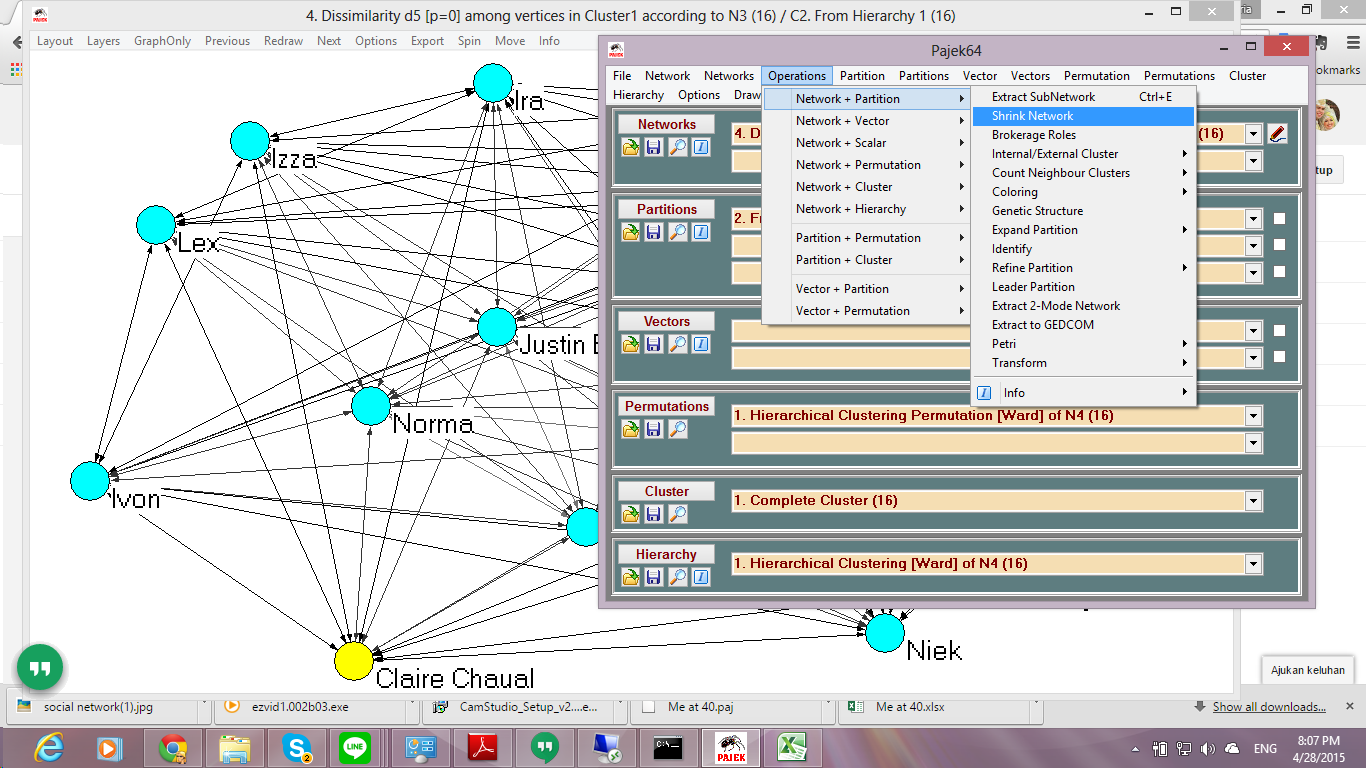
Actually, a network with two clusters can be shrunk. Shrinking a network discloses how clusters are linked to each other and how good the clustering result is.

You can do that by click Operations - Network + Partition - Shrink Network


A small window will pop-up and you have to fill the minimum number of lines between clusters and how many clusters that will not be shrunk.


After you click OK, you can draw the Network + First Partition and the result is like this


You can see in the shrink network results that Claire groups have links with other groups. For example Claire wants to be proud parents and that dream also in Niek group's dreams.

Okay... that's for now about the analyzing 2-mode network using Pajek. Hope it can be useful for you and if you have any questions you can comment down below. :)

Thank you for reading this article  ^^


Analyzing 2-mode Network using Pajek Part 2

Before in Part 1, I give some introduction about Pajek and how to change 2-mode network into 1-mode network before do the simplified network. So, in this Part, I will show you how to do the centrality.

Centrality is a key concept in social network analysis. It is commonly used to measure the importance or power of a node. The concept is  based on the assumption that the position of a node affects its influence to the other nodes in the networks.

To make it simple, if you have a friend that have more friends than you and her/his position in your network is influential, it might be possible that if he/she do something, other people will people. It's just the example.


There are several centralities, which are:

1. Degree Centrality
which means the one who gather more friends, he/she is more influence.
Example :
There is a prom night and I need help from my friends. Only true friends that will come to help

2. Closeness Centrality
which means the one who has in average closer relationship with all other person is more important.
Example :
If there is a vote for school organization chairman, favoring votes come also from indirect friends.

3. Betweenness Centrality
which means the one who is more able to invite more (through multiple channels).
Example :
If there is a prom, the one who able to invites more hot girls  is more important.

4. Bonacich Centrality and Alpha centrality
which means who your friends are is actually quite important
Example :
If there is a big fight in school between two people. But the one who can escape is the one who has higher relationship with teacher.

In here I only want to show how to measure degree, weighted degree, closeness, and betweenness centrality in network using Pajek.

Open your simplified network like I told you before in the Part 1. 


But if you think it's complicated, you can simplified it again. My network is become like this


Then, do the Centrality with perform this action :
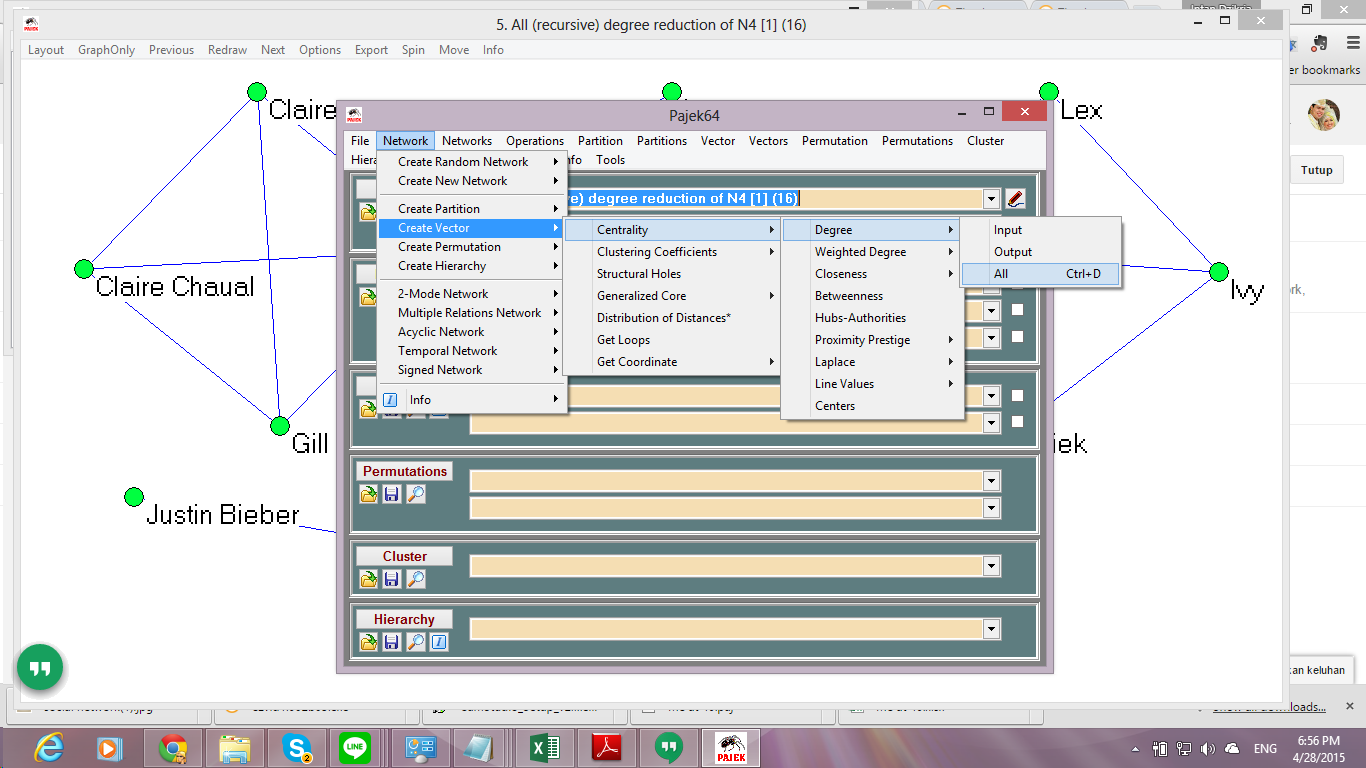
Network - Create Vector - Centrality - Degree - All (degree centrality)
Network - Create Vector - Centrality - Weighted Degree All (weighted degree centrality)
Network - Create Vector - Centrality - Closeness - All (closeness centrality)
Network - Create Vector - Centrality - Betweenness (betwenness centrality)


To draw the network you have to click on Draw - Network + First Vector
You can see in here the results between one centrality and another are different based on what centrality method we want to know.

 Degree Centrality

Weighted Degree Centrality 

Closeness Centrality


Betweenness Centrality

But after see those drawing, how can we know the centrality or the most influence people in the network? You have to export the results using this command Tools - Export to Tab Delimited File - Current Vector - Save File


The saved files are .txt file that you can open using Notepad.


To make it easier, you can move the results to Excel and sort the results for each centrality from highest degree to lowest degree. You can see in the picture below that the results shown people who has high influence in the network are the ones who has yellow color (16 people). But why the result of betweenness centrality is different?


Actually you can connect this result into what each centrality means. Let's break down for each centrality.

1. Degree Centrality and Weighted Degree Centrality
If there's a prom night in school, true friends will come to help. So, in this case 16 people in the yellow color are the people who most likely help their friends in need.

2. Closeness Centrality
If there is a vote for school organization chairman, favoring votes come also from indirect friends. So, in this case if you are one of the candidate, you can ask these 16 people to ask their friends to vote you.

3. Betweenness Centrality
If there is a prom, the one who able to invites more hot girls is more important. But, in this case the degree of all people are 0. I guess no one can invite hot girls/ boys hahaha

But because the case is about students and their dreams in the future, you can connect the result into something in the future. Like for example, they can be marriage partner. For example because Justin Bieber and Norma are most likely have the same preference in their future dreams, they can be marriage partner because they can influence each other.

Hope it can help you and I'm going to continue into Part 3. :)

Analyzing 2-mode Network using Pajek Part 1

This semester I got to learn something interesting called Social Network Analysis. At first I thought it's like social network kinda things, e.g. Facebook, Twitter, etc. But, actually those are social network website and the case for the analysis.

Let me tell you simple thing to think of. You have friends in Facebook right? And your friend have mutual friends with you, and your other friends too. These can build a network, called social network. This network can have many kind benefit, for example who are your friends that have highest influence in your network, so if there's any event you can ask them to tell your friends.

There are two kinds of network, 1-mode and 2-mode network. 1-mode network only have 1 event/actor. For example, your friends network only have your friends' name there. But, 2-mode network has 2 variables, for example your friends' name and their hobbies.

In this article, I will show you how to analyze 2-mode network. This article consists of several parts which are how to dimplify a network, find centrality, and do a clustering.

There are many software for social network analysis, but because I just learn about this software, Pajek, I will use this software instead. Pajek is a free software that you can download here.

First, Open your Pajek and click File - Pajek Project File - Read to read you .paj file
If you don't have .paj file you also can open .net file with clicking File - Network - Read


After you open your file, it will open a Report Window that shows you everything you've done using Pajek. Somekind like a Log windows.


Second, Draw your network with clicking Draw - Network


Your network will be shown in the drawing window. You can change the drawing using several algorithm provided in the Pajek. Just clik on Layout - Energy - Kamada Kawai - Free or Layout Enegery - Fruchterman Reingold - 2D


Another drawing will be like this. Every time you did the the drawing algorithm, it will show different results.


So, because it's a 2-mode network, you have to make it into 1-mode network first before continue to further analysis. Because it will show more comprehensive result from 2 variables (actor and event).

Third, Change the 2-mode to 1-mode network with 
Network - 2 Mode Network - 2 Mode to 1 Mode - Rows (establish event projection)
Network - 2 Mode Network - 2 Mode to 1 Mode - Column (establish actor projection)

The difference between Rows and Column is in the projection. So, for example in here I have a network that the actors are students's name in the class and the events are the dreams. Vice versa.


After the changing into 1-mode network, if I choose the event projection, the drawing will only shown the relation of the students.


But, if I choose the actor projection, the result is only the dreams of the students.


Fourth, Simplify the Network

Let's see the event projection instead because it's more complicated than the actor projection. Because it's too complicated what we want is to make it simpler, but how?

We have to know first the value of each line. The meaning behind it is that one person can have more than 2 dreams, right? but teacher asked students to choose their dreams no more than 4. So, we have network that shown students' choice between 2 until 4 choices. And if we want to make the network simpler, it's up to us the minimum degree of the network.

Okay for example, I want to remove lines that lower than 3. It means, the network only shown students that have 3 and 4 choices of dreams.

To do this, perform this action in the Pajek. Click on the Network - Create New Network - Transform - Remove - Lines with Value - Lower Than


A small window will pop up and insert your threshold value. Mine is 3. So, I type 3 in the box. Then click Ok. There will be another window appear but just click Ok.


When I draw the network, it will be like this. You can see there are several vertices or my friends in the class who have no line or link to another vertices, right? We want to make the network simple, so why not we reduce it?


To reduce the vertices that have no links, you have to perform this action Network - Create New Network - Transform - Reduction - Degree - All

Degree in here is how many links the vertices have. For example, in here the minimum degree I want in my network is 1. Because Sherry and Pietsia have 0 degree, they will be removed from the network.


Input the minimum degree you want, for me I want 1. There will be another window that will pop-up and just click Yes.


When I draw the network, the vertices that have 0 degree is no longer exist in the network.


To see the line number, you can click Options - Lines - Mark Lines - With Values in the drawing window.


Fifth, Save your Network

Finally, don't forget to save your simplified network for further analysis like for clustering because you don't want to perform the same actions from time to time right?

To save your network, you can do click Save button in the Networks section.or click File - Network - Save.

I will go on to the next part of the Pajek tutorial. If you have any question about this part, please comment below. :)

Hope this post help you. ^^

You can see the next part in this link
22 April 2013

The User Continuance Intention of Using E-learning System Based on Social Influence

I have a research and need your help to fill this questionnaire. Feel free to ask if any questions needed from you. This research will be used to measure what kind of factors that can make people like to use e-learning system. Thank you for helping me guys… ^,^

https://docs.google.com/forms/d/18awm-EAgLqcv8LddC7UQpOCOFKFnLu9v2Smk_qQ0A2k/viewform

image

12 April 2013

System Design - Use Case Diagram


Dalam pembuatan sebuah sistem terutama software diperlukan adanya sebuah design terlebih dahulu sebelum memulai tahap programming. Kenapa seperti itu? dikarenakan programmer hanya bertugas mengimplementasikan. Gampangnya sih gini... menurut pengalamanku dan beberapa orang teman sesama programmer, ketika kami diminta membuat sebuah aplikasi tapi tidak diberi tahu function yang mau dibuat apa aja dan mau dibikin kayak apa...kita tuh bingung. Dan ketika aplikasi selesai dibuat, ternyata user ga pingin seperti yang programmer bayangkan. Nah, untuk menjembatani antara user dan programmer, maka ada yang namanya System Designer yang membuat design yang diminta oleh user dan design tersebut bisa dibaca oleh para programmer.

Ada berbagai macam system design yang perlu dipersiapkan oleh designer nya, dan bukan dalam bentuk gambar seperti yang dibuat oleh arsitek lho...haha tapi bentuknya adalah diagram dalam berbagai bentuk dan fungsi. Untuk kali ini aku akan membahas hanya satu jenis diagram. dan aku akan membuat post lain yang berisi tentang diagram lainnya.

Use Case Diagram

13 August 2012

COCOMO


SEJARAH

COCOMO (Contructive Cost Model) adalah sebuat algoritma untuk melakukan estimasi dalam harga (cost) sebuah software yang dikembangkan oleh Barry Boehm. Model ini menggunakan formula dasar regresi dengan parameter yang berasal dari data project yang lama dan karakteristik project baru.
COCOMO pertama dipublikasikan pada tahun 1981 dalam buku Barry W. Boehm yang berjudul Software Engineering Economics sebagai sebuah model untuk memperkirakan efforts (upaya), cost (harga), dan schedule (jadwal) untuk software project. Ini menarik dari study 63 project di TRW Aerospace dimana Barry Boehm dahulu menjadi direktur Software Research and Technology pada tahun 1981. Study tersebut menjelaskan range project dari 2000 sampai 100.000 baris code dan range bahasa pemrograman dari Assembly ke PL/I. Project tersebut berbasiskan Waterfall Model dari sebuah software development yang dahulu merupakan proses pengembangan software yang lazim pada tahun 1981.

05 July 2012

Software Quality Measurement


Seperti pada postingan sebelumnya...artikel ini aku copas dari blog ku yang lain yaitu :http://students.netindonesia.net/blogs/dzikri/archive/2011/05/11/software-quality-measurement.aspx

Kali ini saya akan membahas tentang sebuah topik yang biasanya diperbincangkan oleh para developer software dalam perhitungan kualitas program tersebut. Ada beberapa cara yang bisa digunakan dalam menghitungnya, yaitu dengan melewati beberapa pendekatan diantaranya adalah :
Size Oriented Metrics
Didapatkan dari normalisasi kualitas yang memeprtimbangkan "ukuran perangkat lunak". Apa saja yang menjadi tolak ukur perhitungan? beberapa diantaranya adalah :
  • Jumlah baris kode (KLOC)
  • Jumlah error per KLOC
  • Jumlah cacat per KLOC
  • Biaya yang dibutuhkan untuk menyelesaikan proyek
  • Biaya yang dibutuhkan per LOC
  • Jumlah halaman dokumentasi per KLOC
  • Jumlah person-month untuk menyelesaikan proyek
  • Jumlah error per person-month
  • Jumlah LOC per person-month
  • Biaya yang dibutuhkan per halaman dokumentasi
  • Jumlah error yang diperbaiki sebelum diluncurkan ke pasar.
  • Jumlah bugs yang ditemukan setelah diedarkan.
Rumus :
Produktivitas = KLOC / person-month
Kualitas = Cacat / KLOC
BIaya = Biaya / KLOC
Dokumentasi = jumlah halaman dokumentasi / LOC
Keuntungan :
  • Mudah digunakan
  • Mudah dihitung
  • Banyak digunakan karena mengurangi LOC
  • Mudah membandingkan anatar biaya, waktu, dsb.
Kelemahan :
  • LOC untuk menyelesaikan tugas tergantung dari bahasa yang digunakan.
  • Penggunaan kembali kode mengurangi LOC tetapi membutuhkan banyak usaha, sehingga menghukum sistem yang memiliki desain yang baik.
  • Menggunakan matriks yang berbasiskan LOC mendorong programmer membuat lebih banyak LOC, dimana kurang efisien untuk dipelihara
HALSTEAD'S METRICS
Matriks ini ada dengan maksud untuk mendeskripsikan sebuah perhitungan kuantitatif dari kompleksitas secara langsung dari operator dan operand dalam modul untuk menghitung kompleksitas sebuah program langsung dari source code.
Rumus :
Panjang Program : N = N1 + N2, N1 adalah jumlah total operator dan N2 adalah jumlah total operand.
Vocabulary Program : n = n1 + n2 , n1 adalah jumlah total operator yang berbeda dan n2 adalah jumlah total operand yang berbeda.
Panjang Estimasi : EL = n1 log2 n1 + n2 log2 n2
Purity Ratio : PR = N^ / N
Tingkat kesulitan : D = n1/2 * N2/n2
Volume : V = N * log2 (n1 + n2)
Efforts : E = V * D
Waktu Implementasi : T = E / 18
Jumlah bug yang dikirimkan :  B = (E ** (2/3)) / 3000
Level Program : L = 1/D

So, that's the description about software quality measurement...If you have any further questions, you can contact me ... ^.^